11: Efficiency in Numbers
This chapter addresses the math behind the drawings: first, how changing the
directions of the forces results in reductions in magnitude; how the efficiency of an
escapement design could be calculated; and how to design a pallet blank, by using these
calculations, for a clock that is missing the pallets.
Consider the coordinates of a quarter
circle. If you take a horizontal line one inch long and rotate it by one degree at a time
until you trace a quarter of a circle, you have points on a drawing which shows the
position of each point relative to a horizontal line and a vertical line.
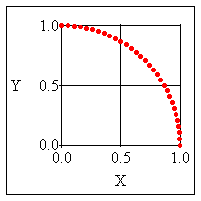 |
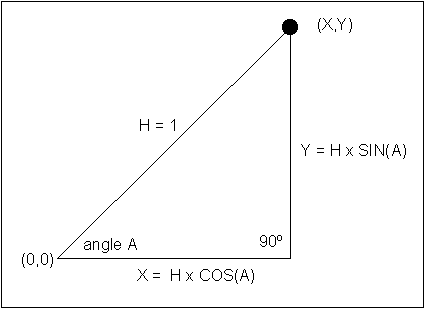
In the graph above, the value of each point
along the X line is given by:
where A is the angle of the line from the horizontal line.
The value of each point along
the Y line is given by:
So each point has a coordinate (X, Y), which could be seen as:
 |
This could be applied to clock escapements. In chapter 4, we considered the action of the escape wheel's tooth as it pushed
upon the entry pallet. The tooth exerted a force Fe in a North-East direction. Since the
impulse face was horizontal, it received the impulse due North.
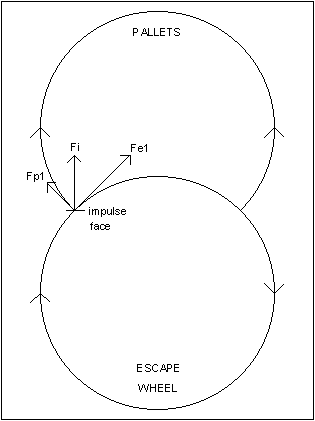 |
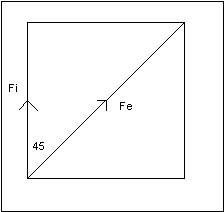
If the lines were positioned to create a
triangle, they could be used for calculation. Fe (100%) goes North-East. Fi is the
portion acting due North:
Fi = Fe x cos (45) = 100% x 0.707 = 70.7%
29.3% efficiency has just been lost!
 |
As the pallet is pushed by the tooth, it
rotates clockwise, so a portion of Fi is received by the pallet to push it in a North-West
direction.
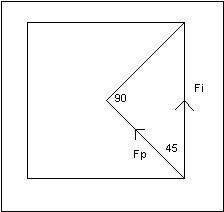 |
As before, calculate the size of Fp:
Fp = Fi x cos (45) = 70.7% x 0.707 = 50%
Fp is therefore half as large as Fe. The efficiency is 50%.
This...
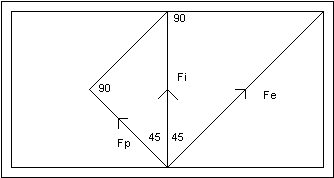 |
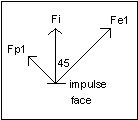
could be used to create this.
 |
If the angle of the pallet's impulse face were changed, the direction of Fi would change,
and therefore the proportion of Fe that could be used to rotate the pallet:
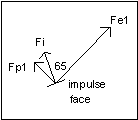 |
Fi = Fe x cos (65) = 100% x 0.423 = 42.3%
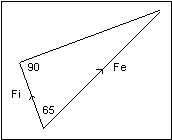 |
The angle FeFp is 90º, and the angle FeFi is
65º, so the angle FiFp is 25º.
Fp = Fi x cos (90-65) = 42.3% x cos (25) = 42.3% x 0.906 = 38.3%
This is less efficient by almost 24% (divide 38.3 by 50) because Fi is not half way between Fe and Fp.
 |
When the angle between two vectors is
small, the loss of efficiency is small: when the angle FiFp is only 25º, the efficiency drops
from 42.3% to 38.3%, a decline much smaller than occurs between Fe (100%) and Fi
(42.3%) when the angle is larger (65º). Therefore, the angle FeFp should be as small as
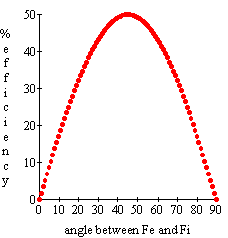
possible. The effects of angles could be computed on a spreadsheet. Look at the charts
below. As the angle FeFi increases, the efficiency increases until Fi is half way
between Fe and Fp, beyond which the efficiency decreases. The graph was created using
the data in this chart. In order for a computer to do the calculations, the angles need to be
expressed in radians: multiply the angles by pi (3.1415) and divide by 180.
 |
The same chart could be used to see what happens when the angle FeFp is changed.
The second chart shows that as the angle FeFp increases, the
maximum achievable efficiency decreases. The maximum efficiency consistently occurs
when Fi is half way between Fe and Fp. This chart was used to create the graph after it. The graph illustrates how the maximum efficiency changes.
Use this chart to determine the effect of having an angle greater than 90º between Fe
and Fp on the entry side. Then determine the effect of having an angle smaller than 90º to
the same extent on the exit side. You would see that the gain in efficiency
on the exit side is offset by the loss of efficiency on the entry side, so the overall
efficiency remains the same. Since there is no advantage in this asymmetry, an angle of
90º on both the entry and the exit sides is preferred.
Anyone with a computer spreadsheet could create this chart. I am using MS Works.
The chart following the graph shows the formulas used. Enter one of the Fp
formulas in the appropriate cell, and then use the "fill-right" and "fill-down" functions to
complete the chart. You could create a chart showing the angles increasing by 1º at a
time. (I chose 2º so as to fit the chart on one page.)
| Go to Efficiency Charts and Graph |
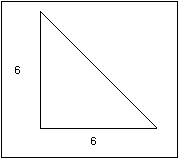
These figures consider the action of the
ideal Graham escapement. In this case, the 30 tooth escape wheel rotates by 6º and the
pallet rotates by 6º as the escape tooth pushes on the pallet's impulse face.
 |
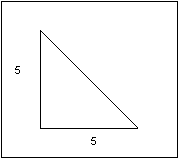
In practice, if 1º were lost for drop, the
triangle would become smaller.
 |
To calculate the work done, multiply the force, which was calculated to be 50% (or
0.5), by the distance (in the direction of Fp) that the pallet is pushed during impulse. Take
the distance as an index of 1 (or 100%), so the work done is: 1 x 0.5 = 0.5. Divide the
distance into six parts because there are 6º of rotation and you need to compare it with
the distance in the practical pallet, after losing 1º to drop. In the practical example, the
distance is: 1 x 5/6 = 0.833. The work done is: 0.5 x 0.833 = 0.417. Therefore, over 16%
efficiency is lost to drop.
Compare the Graham's efficiency with that of the Brocot. This is more complicated
because the angle of the impulse face changes as the tooth slides across the pallet
surface. Since the Brocot impulse surface is a quarter of a circle, the cosine function
could be used to find the angles of the impulse face over the time it takes the tooth to
slide from one end of the pallet to the other. Then Fi and Fp could be calculated for each
angle, followed by the distance the pallet travels in the direction of Fp (in each instant of
time). The force Fp and the distance (X) could be multiplied to get the work done in each
instant, which, all added together, would give the total work done to rotate the pallet in
the direction of Fp. See the Brocot chart below. The total at the bottom gives
the total work done as an index, which could be compared with the ideal Graham escapement. Since the Brocot has a work done index of 0.384 and the Graham of 0.5, the Brocot is less efficient by over 23%!
To get a work done index for the Brocot, allow 1º of drop, as for the Graham. Just
multiply the index by the same factor: 0.384 x 5/6 = 0.32. Therefore, you could say that
the Brocot is only 32% efficient in practice (at best).
The Brocot chart could be used to create a graph. The Brocot graph shows the work done to rotate the pallet in each instant (over the time it
takes the tooth to slide across the pallet).
| Go to Brocot Charts and Graph |
In calculus, the total work done is found by integration, that is, by finding the area
under the curve. I approximated the area by using Simpson's Rule. The Brocot graph
divided the time index into 50 parts, accurate to 2 decimal places. By dividing it into
more parts, I could get a more accurate approximation: dividing it into 10,000 parts, easy
to do on a computer, gave a work done index of 0.3927. If you would like to try this on
your computer, use the formulas on the page after the Brocot graph.
A practical example would demonstrate the usefulness of this information. A friend
asked me to look at the escapement of a Seth Thomas regulator wall clock with
Graham-style pallets. By inspection, I could see that the design was based on a square, so
the impulse face's angle of the entry pallet should have been horizontal and the impulse
face's angle of the exit pallet should have been vertical. On the exit side, the impulse face
was almost vertical, so I decided to leave it alone. On the entry side, the impulse face was
almost parallel to Fe. I estimated the angle FeFi to be about 70º.
Fi = 1 x cos (70) = 0.342
Fp = 0.342 x cos (20) = 0.321
This does not account for drop, so compare this efficiency of 32% with 50%. The clock
was less efficient by more than a third on the entry side because the impulse face's angle
was incorrect. Since there was plenty of lock, I decided to change the impulse face's
angle by as much as I could without sacrificing all the lock. I did this using an Arkansas
stone, installing the pallet frequently to check the lock. The result was not horizontal, but
an improvement over the previous angle. Then I polished, cleaned and oiled the impulse
face. By decreasing the angle FeFi by about 10º, there was an improvement in efficiency:
Fi = cos (60) = 0.5
Fp = 0.5 cos (30) = 0.433
Efficiency improved by over 20%. This example demonstrates how this information is
useful to the repairman. While it may not be possible to adjust the impulse face's angle by
as much as would be ideal, an improvement is surely better than none.
Go to Chapter 11 (part 2)
Table of Contents
Escapements in Motion
Clock Repair Main Page
Links Page